The energy monitor page displays values of measurements in different forms. The AC input current on each bus, AC input voltage, battery voltage, and CPU / Relay voltages are metered. A thermistor monitors CPU and control board temperature, which should not exceed 185F. The 5V meter monitors the control board VCC, the 12V meter indicates control relay power, and battery voltage can be used as a discharge indication.
Batteries are fully charged at 5.60V and 90% discharged at 4.60V. Note that if you detach the battery, the reading will be at or above 5.60V, so you should make sure the battery is in fact connected before relying on this indicator.
The image format can be configured on the setup page.
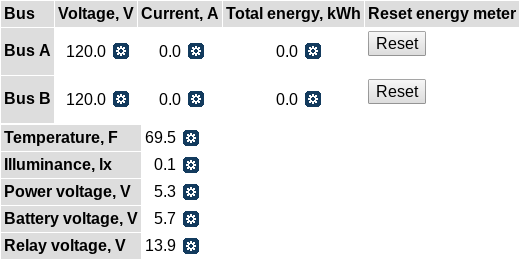
The rest of the page is occupied by user-configurable meters and plots. You can use the ![]() icon to add a new meter or plot, or the
icon to add a new meter or plot, or the ![]() icon to delete an existing one.
icon to delete an existing one.
Use the ![]() /
/ ![]() icon to toggle visibility of a plot or meter. The setting persists (unlike visibility of configuration blocks).
icon to toggle visibility of a plot or meter. The setting persists (unlike visibility of configuration blocks).
Plots and meters can be configured in detail by clicking on them.
Meters

Clicking on a meter allows to configure it.
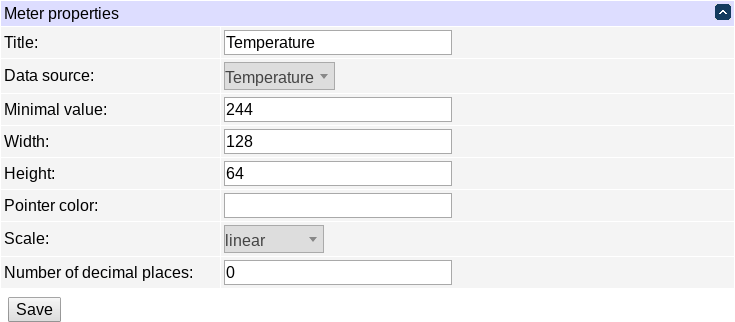
The basic meter properties include:
- the title;
- the width in pixels;
- the height in pixels;
- the main color of the pointer, in hex web notation without '#';
- the minimum (leftmost) value to display;
- the gauge's scale (linear or logarithmic);
- the number of digits to display after decimal point;
- the data source.
A meter should have one or more sectors, which define different ranges of the value to indicate. The end of one sector's range is the beginning of the next one's range; for the start of the first sector's range, the "minimum value to display" setting is used.
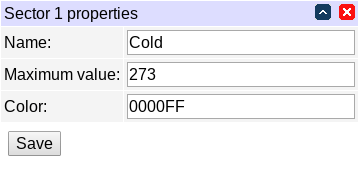
The sector properties include:
- the name of the sector (currently unused);
- the maximum value for the sector (and also the minimum value for the next sector);
- the sector color, in hex web notation without '#'.
Plots
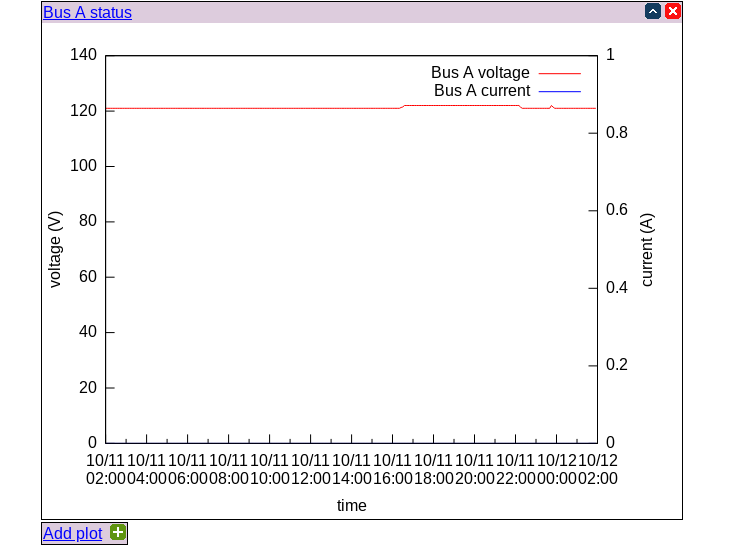
Clicking on a plot allows to configure it.
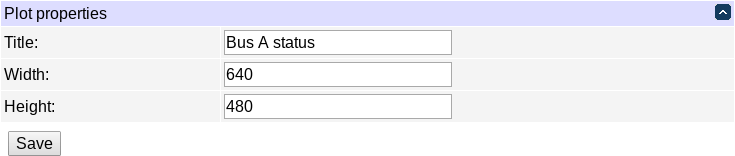
The basic meter properties include:
- the title;
- the width in pixels;
- the height in pixels.
The rest of meter configuration is centered around axes and plot lines which are drawn on them.
There are 4 axes: x1 and y1 are the usual ones; x2 is at the top, and y2 is at the right side.
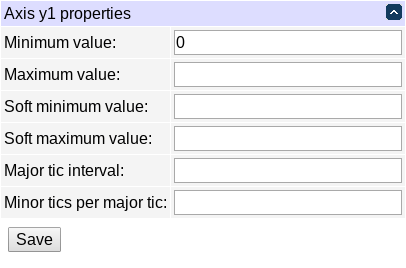
Each axis has the following properties:
- minimum/maximum values: these specify the exact plotting value range;
- soft minimum/maximum values: these specify a range with limits which can be exceeded;
- major tic interval/minor tics per major tic: configure the axis tic behaviour;
The interaction between hard and soft limits is as follows:
- if no limit is specified, the plotting range is determined by the data to be plotted;
- if only a hard limit is specified, it's obeyed;
- if only a soft limit is specified, it's obeyed unless data exceed it, then data are obeyed;
- if both limits are specified, the soft limit (which should be less strict than the hard limit) is obeyed unless data exceeds it, then data are obeyed unless they exceed the hard limit (which should be stricter than the soft limit), then the hard limit is obeyed.
Several plot lines can be drawn on the same plot (they don't have to be proper lines but may have various shapes, see below).
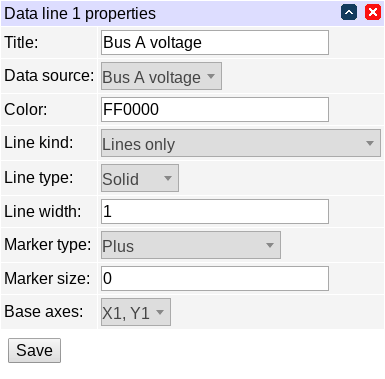
Each plot line can be one of the following styles:
- lines only;
- markers only;
- lines and markers;
- small dots;
- step lines;
- boxes;
- spline smoothed lines;
- approximated spline smoothed lines;
- Bezier smoothed lines;
- vertical lines.
Solid/dotted/dashed lines are supported. Data points can be displayed using a variety of markers:
- empty/filled circle;
- empty/filled square;
- empty/filled triangle;
- empty/filled inverse triangle;
- empty/filled rhombus;
- plus;
- dot;
- cross.
Line width and marker size can be configured. Colors have to be specified in hex web notation without '#'.
Each plot line is plotted on a combination of x and y axes. Plot lines which are plotted against the same axis must have matching measurement units along that axis; e.g. if you want voltage and current on the same plot, they need to be plotted against different y axes but can share the same x axis (time).
If spline interpolation is requested and it fails, the line is plotted using Bezier curves instead.
Alarms
Every measured value can trigger 'alarms' when it is in a certain value interval; those alarms can be made periodic. Alarms carry a 'level', which is an administratively assigned number; the range of these numbers is entirely up to the user; it may be used in notification rule conditions (e.g. 'value_alarm_level>2'); it's intended that alarm levels for different values correspond to the associated severity/risk value so that the notification rules can be made generic (and independent of concrete values).
Configuration of meter value alarms is done not on the notification page, but on the energy monitor page. You can configure a meter value's alarms by clicking the ![]() icon next to it. This will open the interval alert configuration page for it.
icon next to it. This will open the interval alert configuration page for it.
Every measured value is a just a number, or 'none' for some meters on some devices which are detachable, so it makes sense to say there's no value.
The real line of the possible values can be partitioned into intervals using threshold points: e.g. voltage can be below 100V, between 100V and 140V or above 140V, so there are two points, 100V and 140V, splitting the real line into 3 intervals. The idea is similar to configuring sectors of a meter's visual appearance.

Each of the intervals can be assigned an alarm level, which can then be analyzed by notification server conditions (you can also 'none' if you explicitly wish to send no events for that interval).
It is often desirable to keep some level of hysteresis between two adjacent intervals, so that there is some threshold the value needs to cross before we consider that it has left one interval and entered a different one, to avoid needless notifications. This is accomplished by further splitting the threshold points into the top and bottom values. If a value increases and crosses the interval boundary, we only consider that it has switched intervals after it's above the top value. Likewise, if a value decreases and crosses the interval boundary, we only consider that it has switched intervals after it's below the bottom value. E.g. you could use 95V and 105V for the bottom and top values of the 100V threshold point in the previous examples for a 10V hysteresis.

Each interval is characterized by its lower threshold point (with its bottom and top values), its alarm level and period. The exception is the lowest interval which has no threshold point (but still has a level and a period). The "none" value is considered so distinct from all regular values that no hysteresis is possible, so it is also characterized by a level and a period only.
The above sample configuration might look like this:
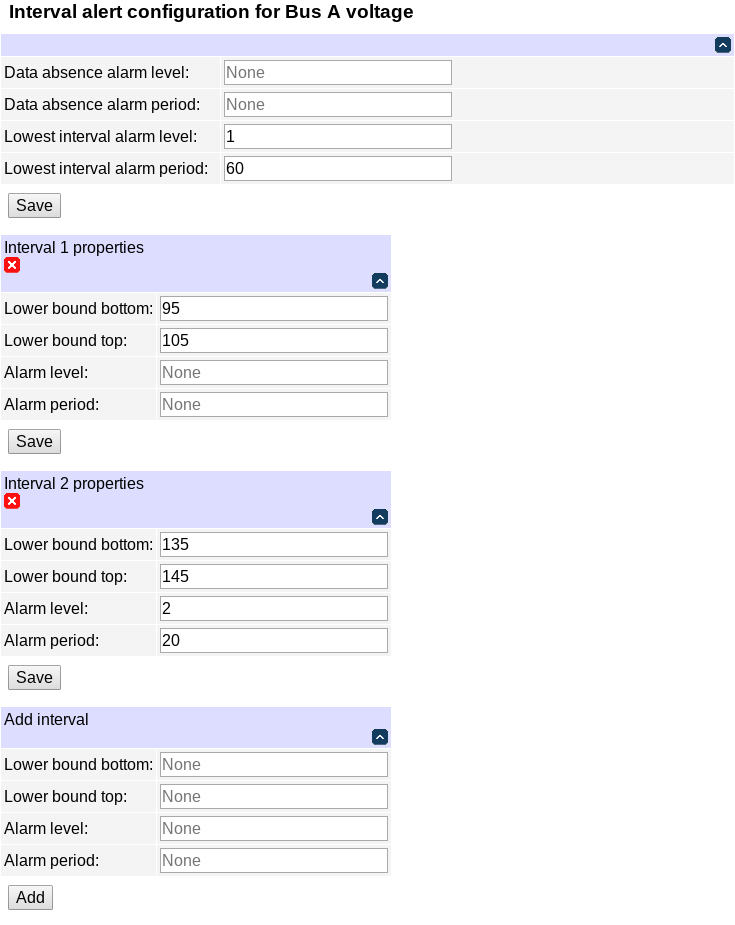
Here, we trigger a level 1 alarm every minute if the voltage is below 100V and a level 2 alarm every 20 seconds if the value is above 140V.